Solana has just entered August in a consolidation phase after a 40% rally in July. This is what the indicators signal for the month ahead.
Solana (SOL) closed July on a high note, even despite a surprise crash in price towards the $169 price level between 23 and 30 July.
As of writing, the price outlook for Solana in August now hangs in the balance as traction slows. On-chain metrics are cooling off and traders are now questioning the coin’s next move.
Solana (SOL) Price Outlook Begins With July’s Bull Run
After climbing 40% in July and reaching a high of $206.19, SOL now appears to be trading near the $180 zone. Technical and on-chain data show that the cryptocurrency is in a period of consolidation, and analysts are wondering what August has in store.
Solana’s price outlook for August largely depends on what happened in July. The cryptocurrency rallied from around $147 to over $206 by July 22, after closely tracking Bitcoin’s climb.
This rally wasn’t just speculative, it was backed by solid fundamentals.
Total Value Locked (or TVL) across Solana’s DeFi protocols surged by 14% to around $9.85 billion, according to DefiLlama. Trading activity on decentralized exchanges (DEXs) also increased, with volumes rising by 30% and surpassing $82 billion.
Source: DefiLlama
The rally brought more revenue into the Solana network because since July 1, the network generated $4.3 million in protocol revenue. This is a 13% increase over the previous month.
However, by the end of the month, prices had crashed to $169 and indicators were flashing warnings.
On-Chain Activity Slows as August Begins
One of the earliest signs of a cooldown in the Solana (SOL) price outlook for August was the drop in user engagement. Daily active addresses fell by 16% over the past week, according to Artemis.
Historically, fewer active wallets indicate that there is less demand for Solana-based dApps, lending platforms and DEXs.
This slowdown was also one of the factors that affected TVL, which has declined by 8% in just seven days. This can mean that users are pulling funds out or the market value of their locked tokens has dropped.
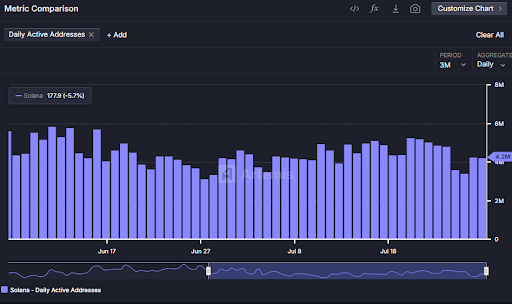
Source: Artemis
A drop in activity often leads to less fee revenue and reduced investor confidence. As such, this tends to trigger price corrections (which is what happened between 23 and 30 July).
Bulls Step In At $169
Technically, Solana is hovering near its 20-day exponential moving average (EMA) of $178.25, after the bulls saved prices from further decline around $169.
In essence, if a price decline plays out again and SOL drops below its 20-day EMA again, it could signal more losses, possibly down to $171.78.
Right now, SOL currently trades around $180.49 and the Relative Strength Index (RSI) stands at 54.60, which is neutral. The MACD indicator is flashing a bearish divergence, while the Chaikin Money Flow (CMF) shows light buying interest.
It is important to keep in mind that the $177.78 pivot point has acted as both support and resistance lately. This means that if SOL breaks above $186.40 and then $190.47, bulls could push it back toward $200 and beyond.
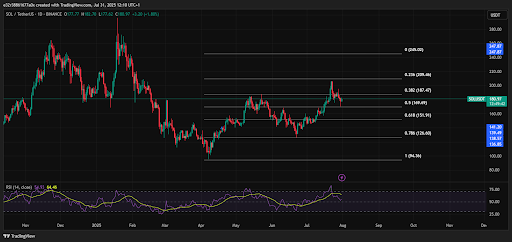
Source: TradingView
If you’re a conservative investor, it may be best to wait until SOL clearly breaks above the $193–$201 resistance zone.
More aggressive traders may consider accumulating near $170, while using $157 as a stop-loss level. Swing traders could play the $175–$190 range, but should keep tight stop-losses considering the current volatility.
Overall, the Solana price outlook for August shows that a wait-and-watch approach is always the right way to go.