Upbit and Bithumb posted record negative Bitcoin volume on May 19 as Binance stayed green. Days later, STH Market Cap shed $65B. The divergence no one saw coming.
Something broke first in Seoul. On May 19, Upbit posted the largest negative Bitcoin spot volume reading in the exchange’s recorded history, negative $9.3 billion in a single session. That alone was unusual. Bithumb Korea, trading the same asset in the same timezone, added another negative $1.8 billion on the same day.
Source:CryptoQuant
Combined, the two Korean exchanges registered approximately negative $11.12 billion. The chart, published via CryptoQuant, shows the reading as a spike well below any prior session.
Binance, meanwhile, was not doing the same thing.
When Seoul Sells, and Binance Does Not, Pay Attention
The world’s largest exchange by volume recorded a normal positive reading of around $1.1 billion that day. No spike. No anomaly. The divergence between Korea and Binance on that single date was stark enough to read without squinting at the chart.
Per the CryptoQuant calculation method, Bitcoin spot volume turns positive when BTC/USDT trading volume exceeds USDT/BTC. When the reverse happens, the reading flips negative. On May 19, the reverse-side dominated both Upbit and Bithumb Korea during that session. In plain terms, more people were converting their USDT to BTC side rather than the other way. The imbalance, at that scale, had not appeared before on Upbit’s chart.
$65 Billion Gone. Three Days. Levels Not Seen Since June 2024.
Then came the follow-through.
Bitcoin’s Short-Term Holder Market Cap began declining. Between May 21 and May 24, the metric dropped from $388 billion to $323 billion. That is roughly $65 billion erased in three days.
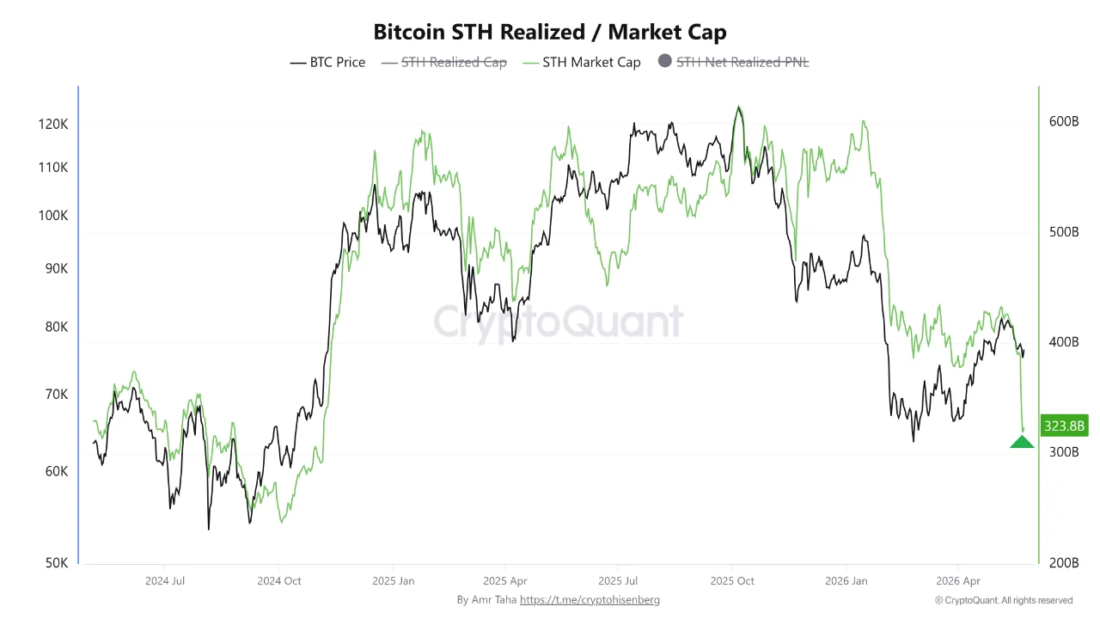
Source:CryptoQuant
The figure landed at levels last seen around June 29, 2024. A drop of that speed in the STH Market Cap is typically read as capital exiting the hands of newer holders, people who bought Bitcoin recently enough to still be classified as short-term participants. The chart confirms the current STH Market Cap reading sits near $323.8 billion, marked visibly in green on the right axis.
That capital did not vanish quietly. It repriced, redistributed, or left. Any of those outcomes carries weight.
The sequence matters here. The Korean exchange anomaly came first, on May 19. The STH metric deterioration arrived after, between May 21 and May 24. Whether the Korean volume imbalance acted as a leading indicator or simply preceded the broader move by coincidence is not something the data alone resolves.
What it does show is two signals arriving in close succession. One on the exchange level, one on the on-chain level. The gap between them was about two days.
The STH Market Cap reading has now pulled back to a point last touched nearly a year ago. Newer market participants, by the numbers, are holding less capital in the market than at any point since mid-2024.