ETF demand weakens while whale signals and miner activity suggest quiet accumulation beneath rangebound price action.
Bitcoin has traded sideways after a sharp correction earlier in the year. Price fell 35% between Jan. 14 and Feb. 5, then entered a tight range. For the past 22 days, BTC has moved between $60,000 and $70,000. Beneath muted price action, adoption-linked metrics are sending mixed signals across ETFs, whales, miners, and corporate treasuries.
ETF Demand Weakens as Bitcoin Searches for Direction
When viewed over a long timeframe, Bitcoin investment vehicles have turned negative. As per data, the 90-day rolling average of net flows has dropped to -$2.18 billion. Over the past two years, readings fell below zero only twice. The first was from March to May 2025 and again starting Dec. 11, 2025. Interestingly, both periods aligned with corrective price phases.
Image Source: Bold.Report
A negative rolling average indicates that more money is leaving ETFs than entering over time. As a result, overall demand weakens, and price gains become harder to sustain. Without steady buying from large investors, rallies often lose momentum.
On the other hand, a move back above zero would show that big investors are returning. If inflows stay positive, liquidity usually improves and price trends strengthen. Until that happens, ETF data suggests caution rather than strong growth.
Whale Crossover and Mining Strength Point to Quiet BTC Accumulation
CryptoQuant tracks the one-year change in holdings for addresses holding 1,000 to 10,000 BTC. From June to November 2023, that cohort accumulated more than 200,000 BTC while the price ranged between $25,000 and $30,000.
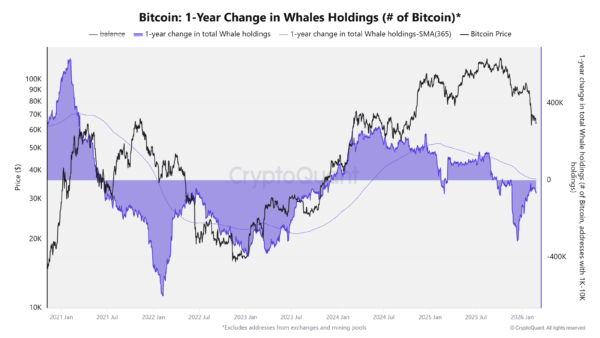
Image Source: CryptoQuant
During that period, the raw one-year change crossed above its 365-day moving average. Faster accumulation relative to long-term trend suggested supply absorption. Sideways trading later gave way to a strong bullish move.
A similar crossover would suggest large investors are buying again. If the one-year change stays above the 365-day average, it would show stronger buying even while the price moves sideways. Without that signal, Bitcoin may continue trading in a tight range.
Bitcoin’s 30-day mean hash rate stands near 0.99 zettahashes per second. The November 2025 peak reached about 1.10 ZH/s. More so, both hash rate and price have drifted lower in recent weeks.
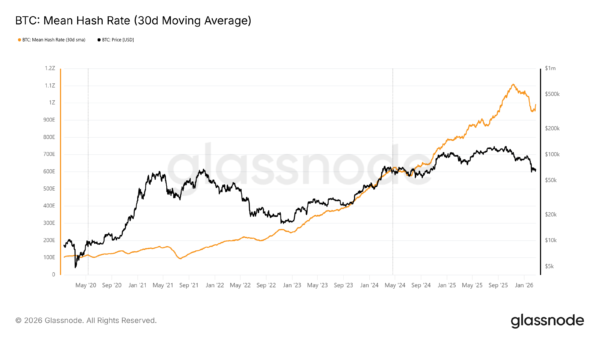
Image Source: Glassnode
Hash rate shows how much computing power secures the network and how much miners invest in machines and energy. When hash rate rises while price moves sideways, it often means miners believe in Bitcoin’s long-term outlook. In other words, growing infrastructure during flat prices points to confidence.
Meanwhile, revenue conditions typically improve if hash price stays stable and miners sell less. Therefore, a rising hash rate without financial stress is a stronger sign than growth driven by tight margins.
Treasury Accumulation Cools While Bitcoin Holds Range Post-Selloff
Bitcointreasuries.net reports companies added about 43,200 BTC in January. Strategy accounted for roughly 40,150 BTC of that figure. Monthly additions once ran much higher. Strategy added nearly 148,000 BTC in November 2024 and 87,000 BTC in July 2025. However, the current pace marks a sharp slowdown.
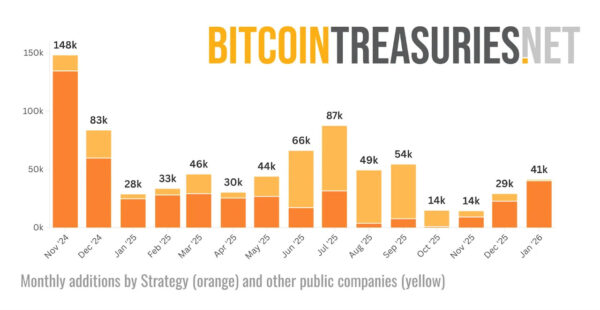
Image Source: Bitcointreasuries.net
Public companies now hold about 1.13 million BTC. However, the latest monthly increase equals only about 0.1% of their total holdings. As a result, the data points to steady positions rather than fresh buying.
When companies slow down their Bitcoin purchases, new demand in the market weakens. As a result, more supply stays available instead of being absorbed.
Bitcoin has stayed between $60,000 and $70,000 as these mixed signals balance each other out. More money flowing into ETFs or bigger company purchases could push the price higher. At the moment, the market is still absorbing supply after the earlier drop.