Record-low RSI and a 50% OI drop signal deep stress as ETF outflows weaken institutional support.
Bitcoin has printed one of the most extreme technical readings in its history. Momentum has collapsed to levels never recorded on the weekly timeframe. As spotted by Ash Crypto, weekly RSI has fallen below every prior macro panic event. Notably, the current conditions place Bitcoin in rare statistical territory.
Historic RSI Breakdown Meets 50% Open Interest Collapse in Bitcoin Market
Trading near $64,000, Bitcoin’s weekly RSI has dropped into the mid-20s. That reading sits below levels seen during the Mt. Gox collapse, 2018 bear market bottom, March 2020 COVID crash, and 2022 FTX selloff.
BITCOIN JUST MADE HISTORY.
But it’s not something we all wanted.
Bitcoin weekly RSI has just reached its lowest level in history.
– Lower than tariffs Crash
– Lower than the FTX crash
– Lower than the Covid Crash
– Lower than the 2018 bottom
– Lower than the Mt. Gox hack… pic.twitter.com/HRWQZD0GRY— Ash Crypto (@AshCrypto) February 24, 2026
Historically, major cycle lows have formed when the weekly RSI reached the 30–35 range. Even during capitulation phases, readings rarely stayed under 30 for long. Current compression marks an outlier in Bitcoin’s price history.
Derivatives data shows clear stress across the market. Open interest across exchanges has dropped from around $45–47 billion at the 2025 highs to about $21 billion. That is a decline of more than 50%. As a result, many traders have closed or been forced out of their positions, even though the price is still well above past-cycle lows.
Image Source: CryptoQuant
At the same time, liquidations have removed excess risk faster than the spot price has fallen. In previous cycles, sharp drops in open interest were often followed by large price moves. However, direction usually depended on whether strong spot buying returned.
BTC Faces Multi-Timeframe Pressure as Valuation Nears Long-Term Support
On-chain data shows more pressure building, but not full capitulation. As per data, the MVRV ratio has dropped to around 1.1, which is close to long-term value support. In past cycles, market tops formed above 2.5. Meanwhile, normal mid-cycle conditions ranged between 1.5 and 2.0. Capitulation usually appeared near 1.0.
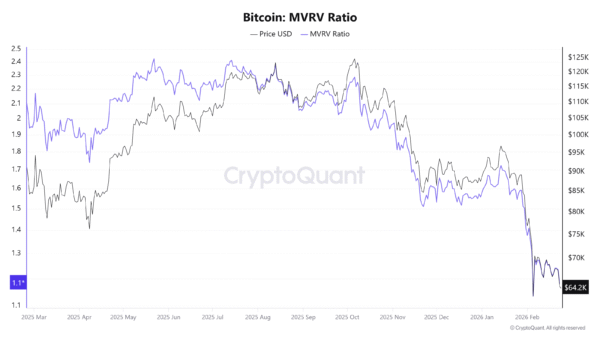
Image Source: CryptoQuant
At current levels, Bitcoin is trading close to the average cost basis of holders. However, it has not fallen below 1.0, where deeper loss conditions and stronger long-term bottoms often form.
At the same time, institutional flows look weaker than in past resets. Spot Bitcoin ETFs have seen about $1.2 billion in monthly net outflows. As the price declined, total net assets also moved lower.
During the 2024–2025 rally, steady ETF inflows helped push prices higher. Now, price is falling while flows remain negative. As a result, institutional demand appears to be slowing rather than returning.
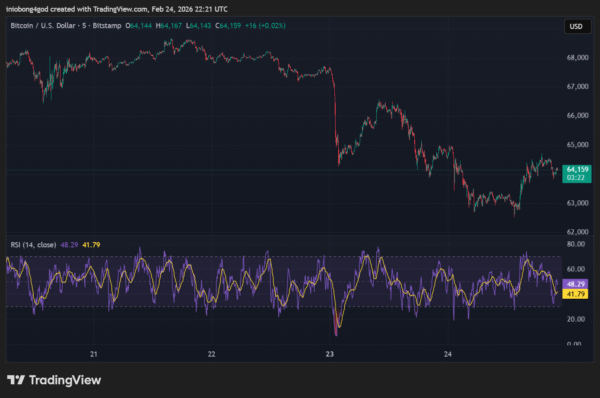
Image Source: TradingView
Short-term momentum is starting to stabilize. The five-hour RSI recently dropped into oversold levels, then bounced back toward neutral. As a result, immediate selling pressure seems to have eased around the $64,000 area.
However, higher timeframes remain deeply oversold. So while short-term pressure has cooled, longer-term momentum is still very weak, creating tension across multiple timeframes.